student reading behaviors
how, when, and why students read, and what it means for product design.
how do undergraduate students balance academic and leisure reading across different contexts and devices, and what does that reveal about how reading-focused products should be designed?
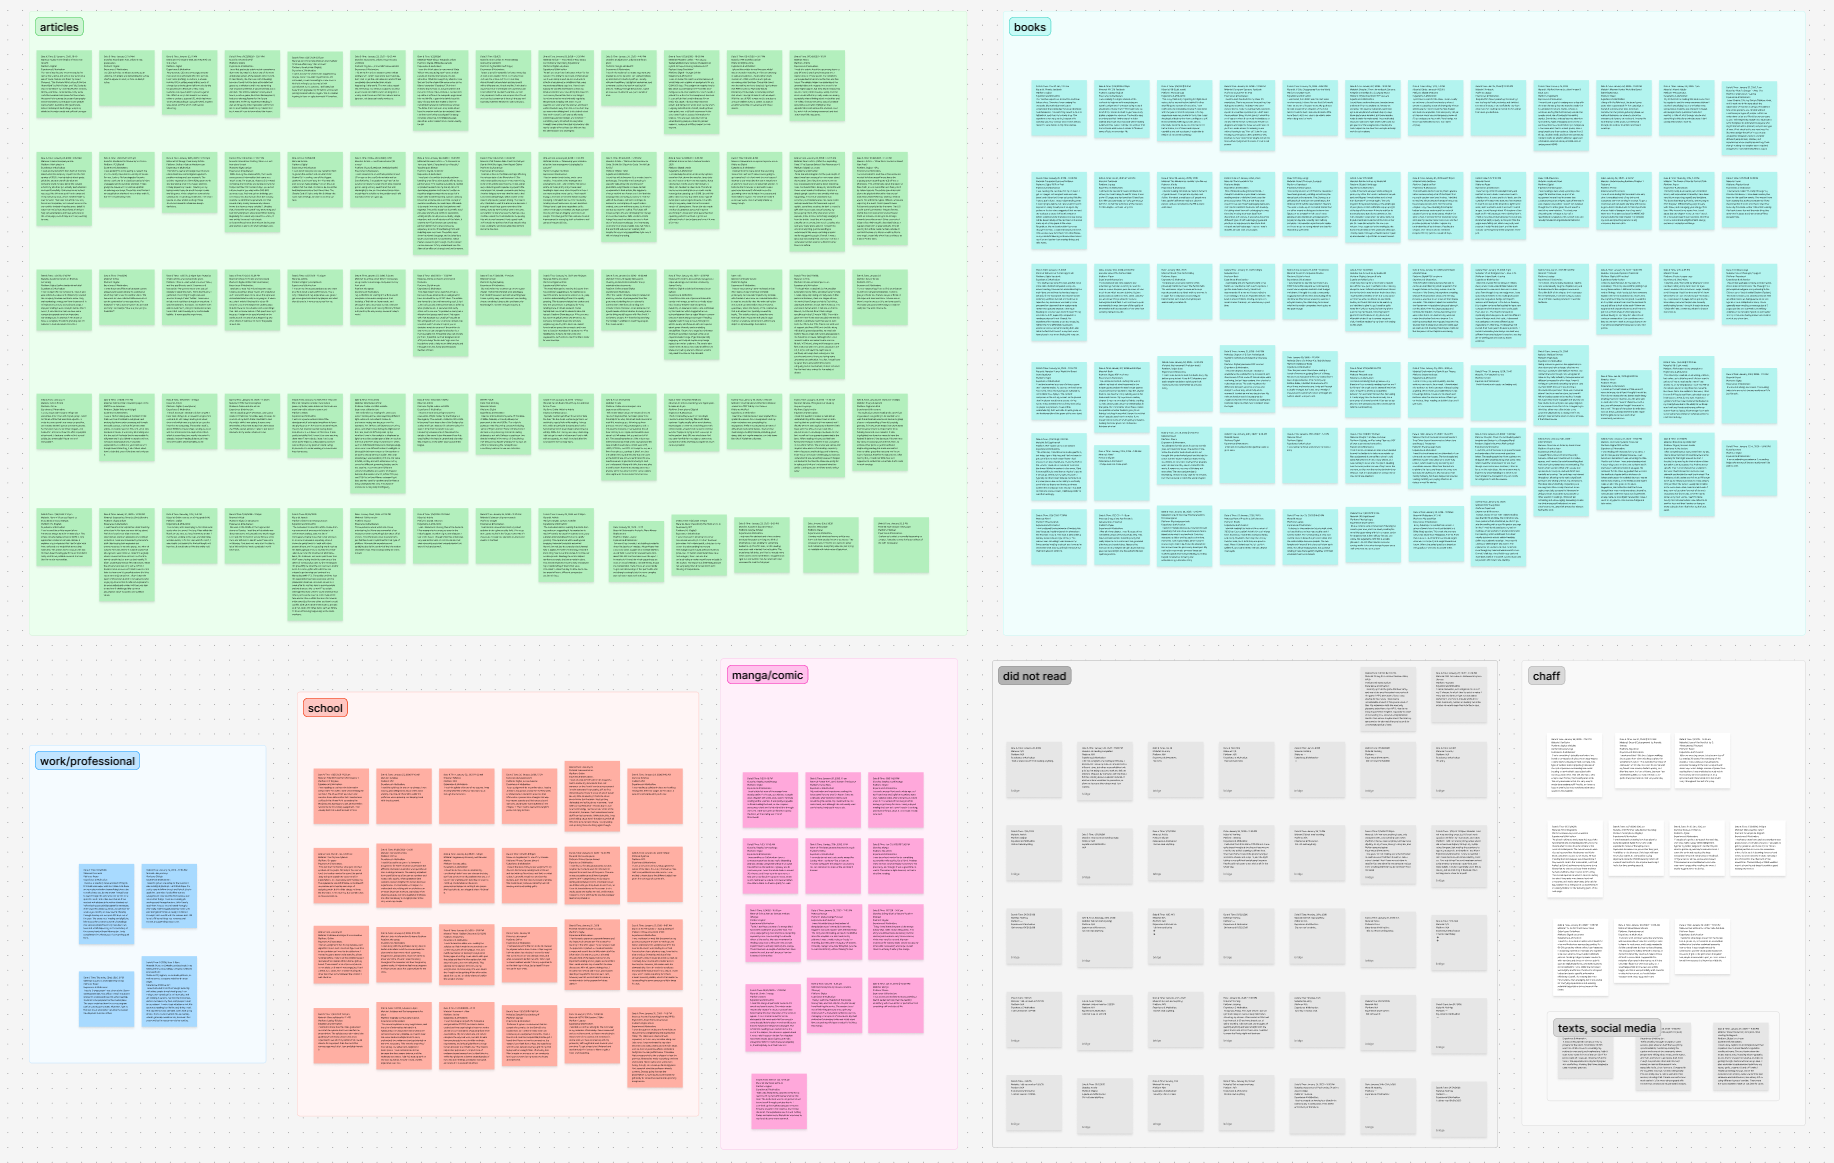
working from a dataset collected through a course-run diary study at njit, i was responsible for all categorization, affinity diagramming, and interpretation. the study captured over 228 reading events across approximately 50 participants, who logged what they read, how, when, and why, including days when no reading occurred.
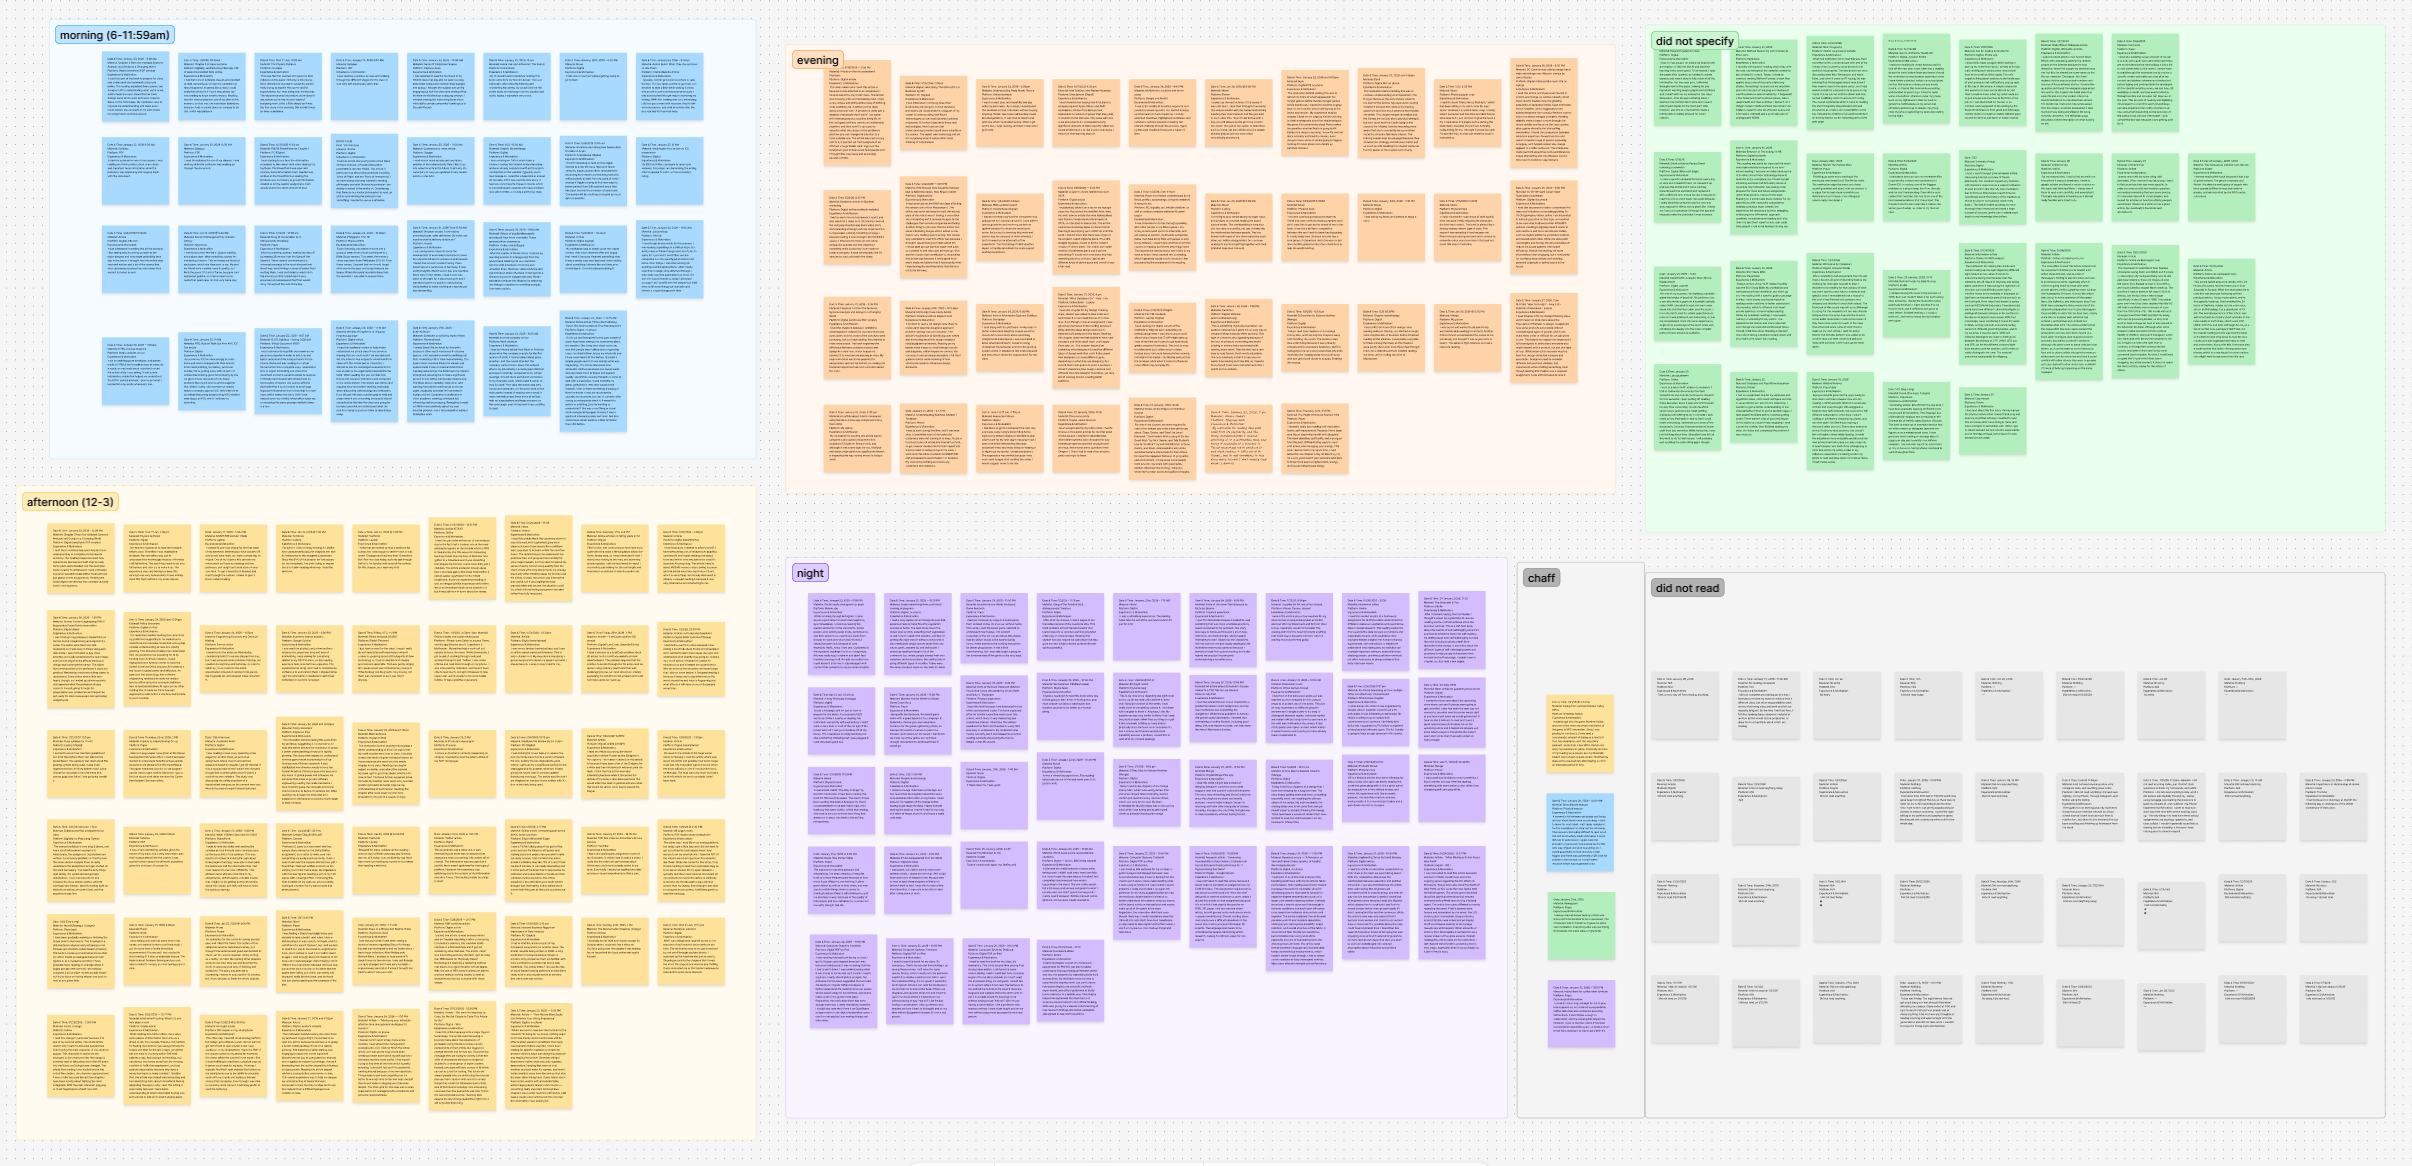
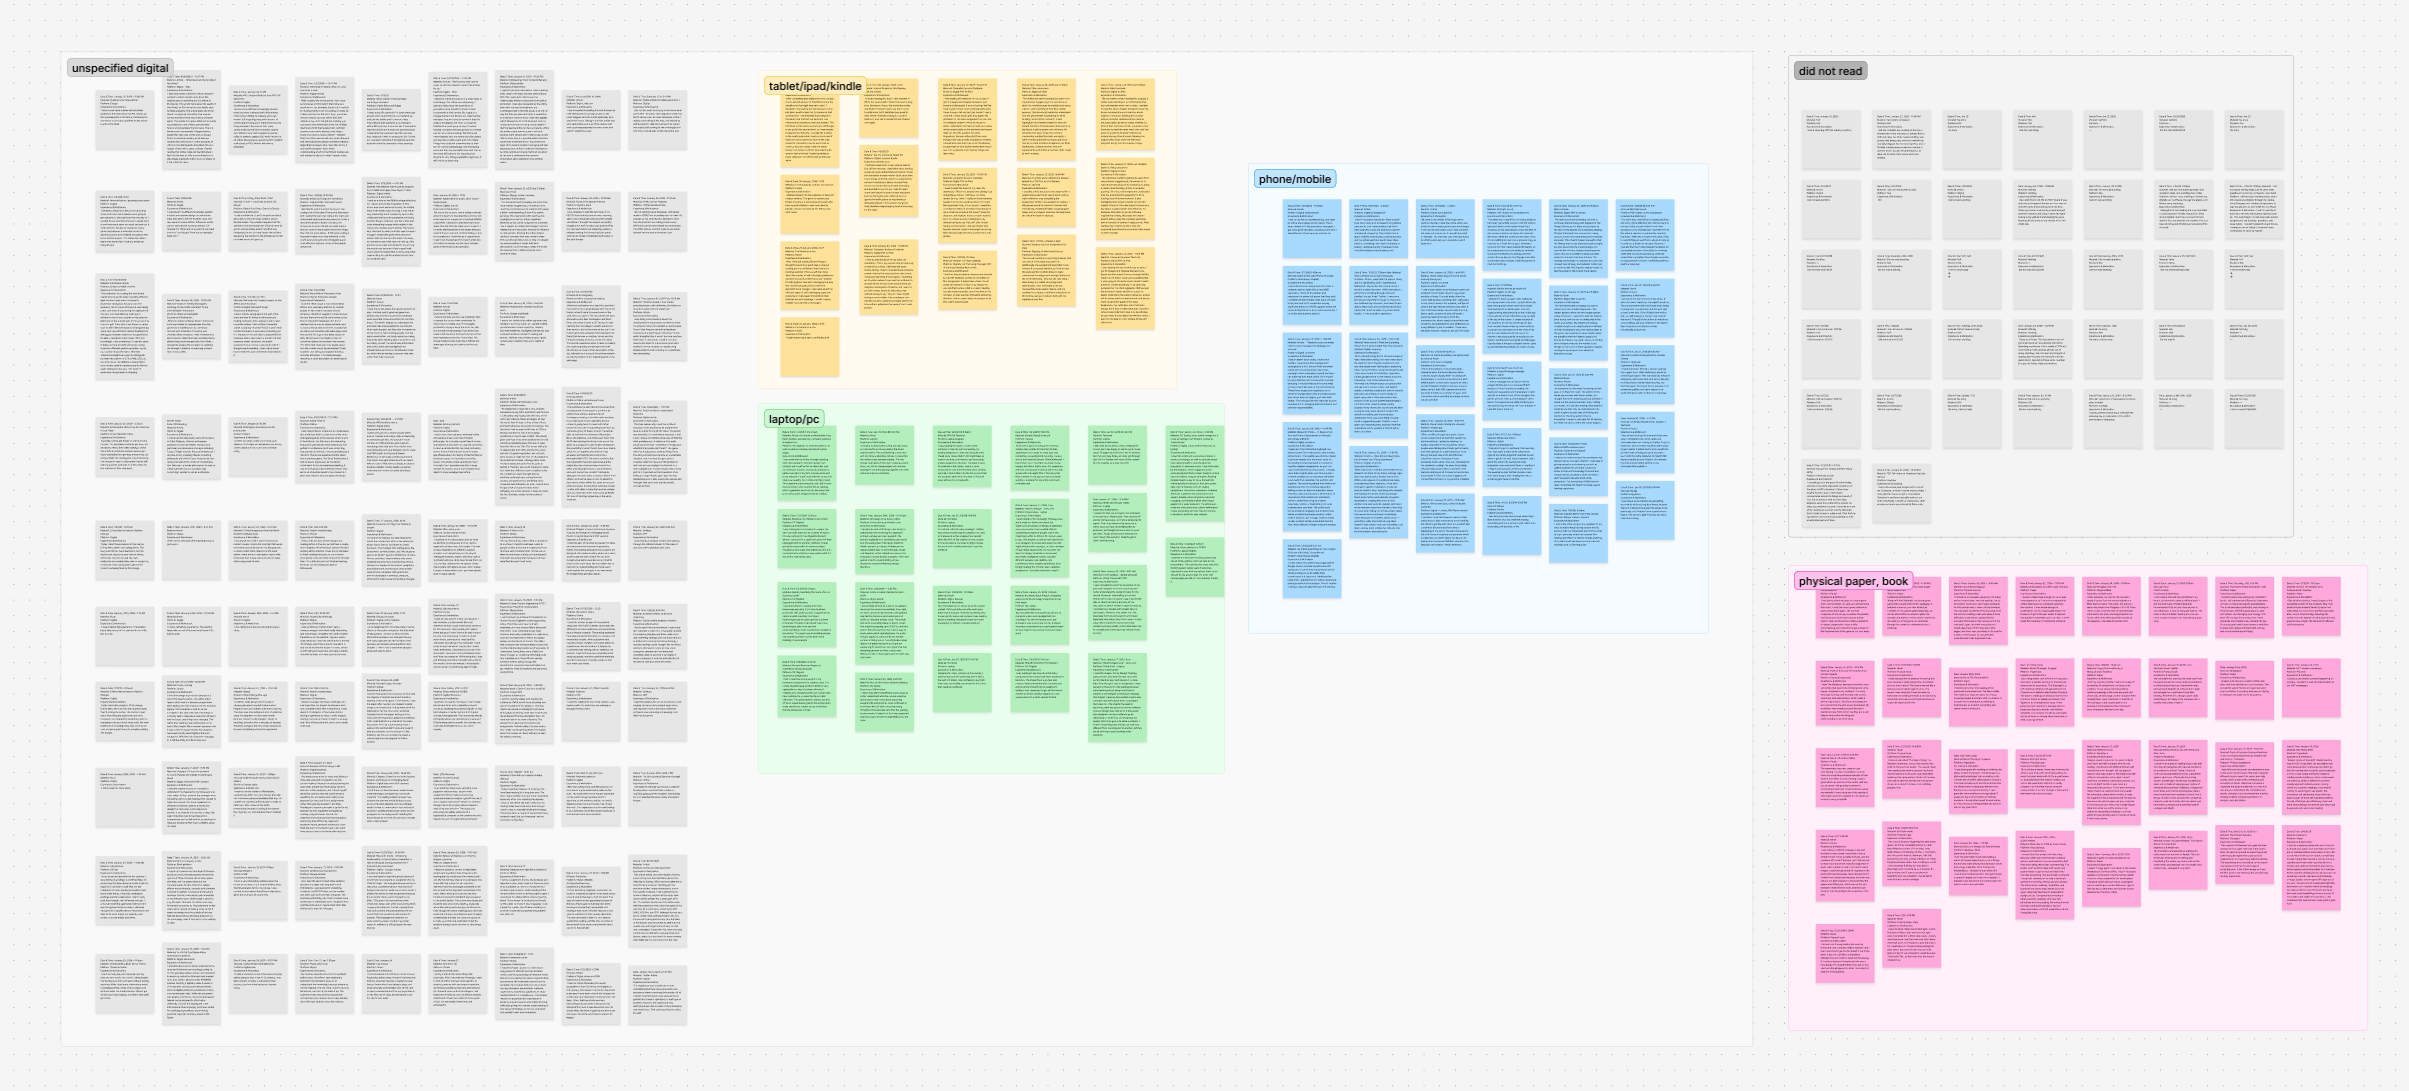
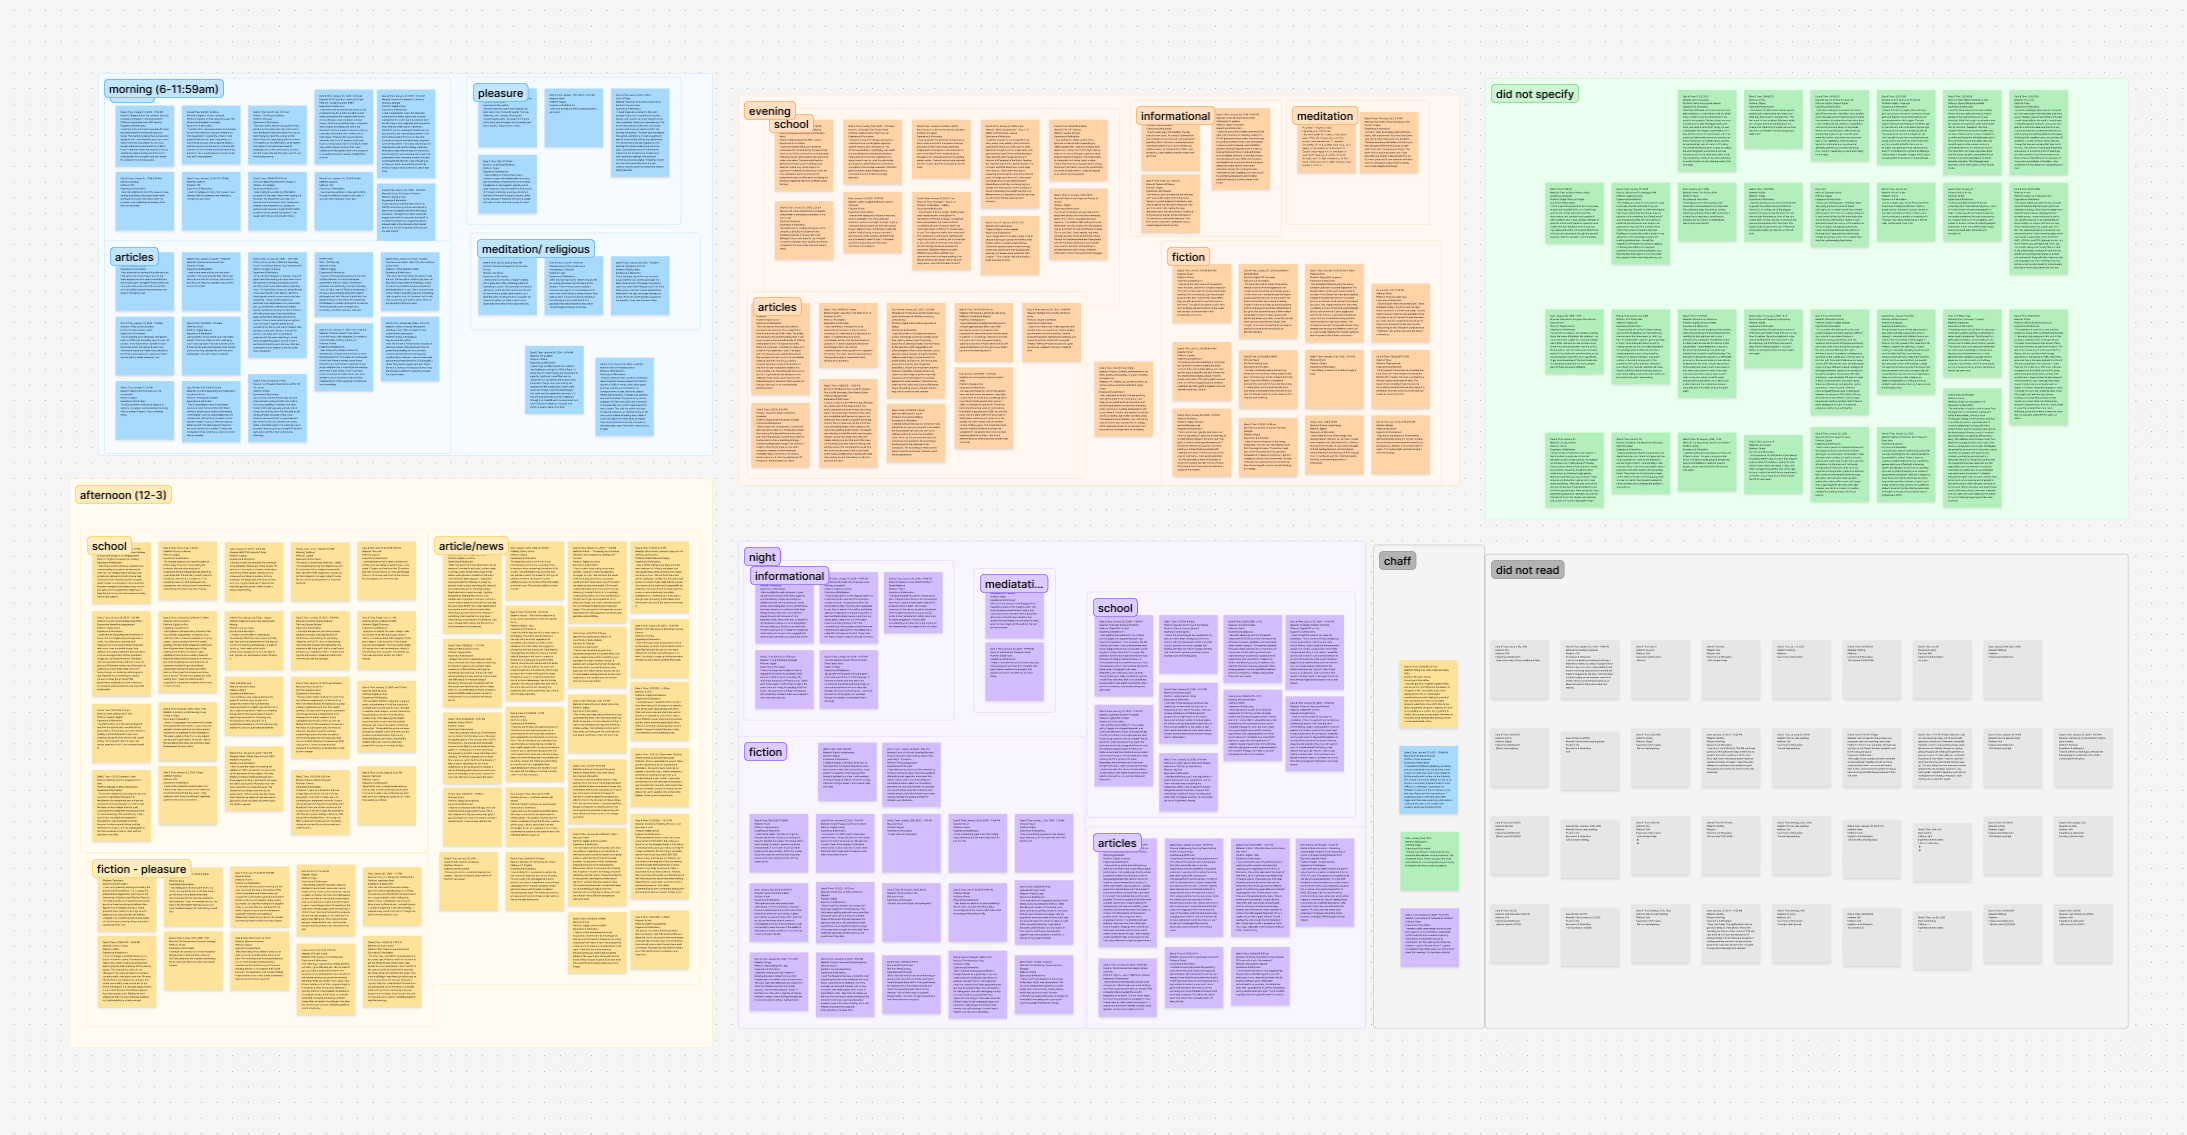
i built five affinity diagrams in figjam: three primary diagrams covering content type, time of day, and reading modality, and two cross-diagram analyses comparing modality with content and timing with content. rather than discarding ambiguous entries, i created a separate category to preserve data integrity while keeping the primary clusters analytically clean.
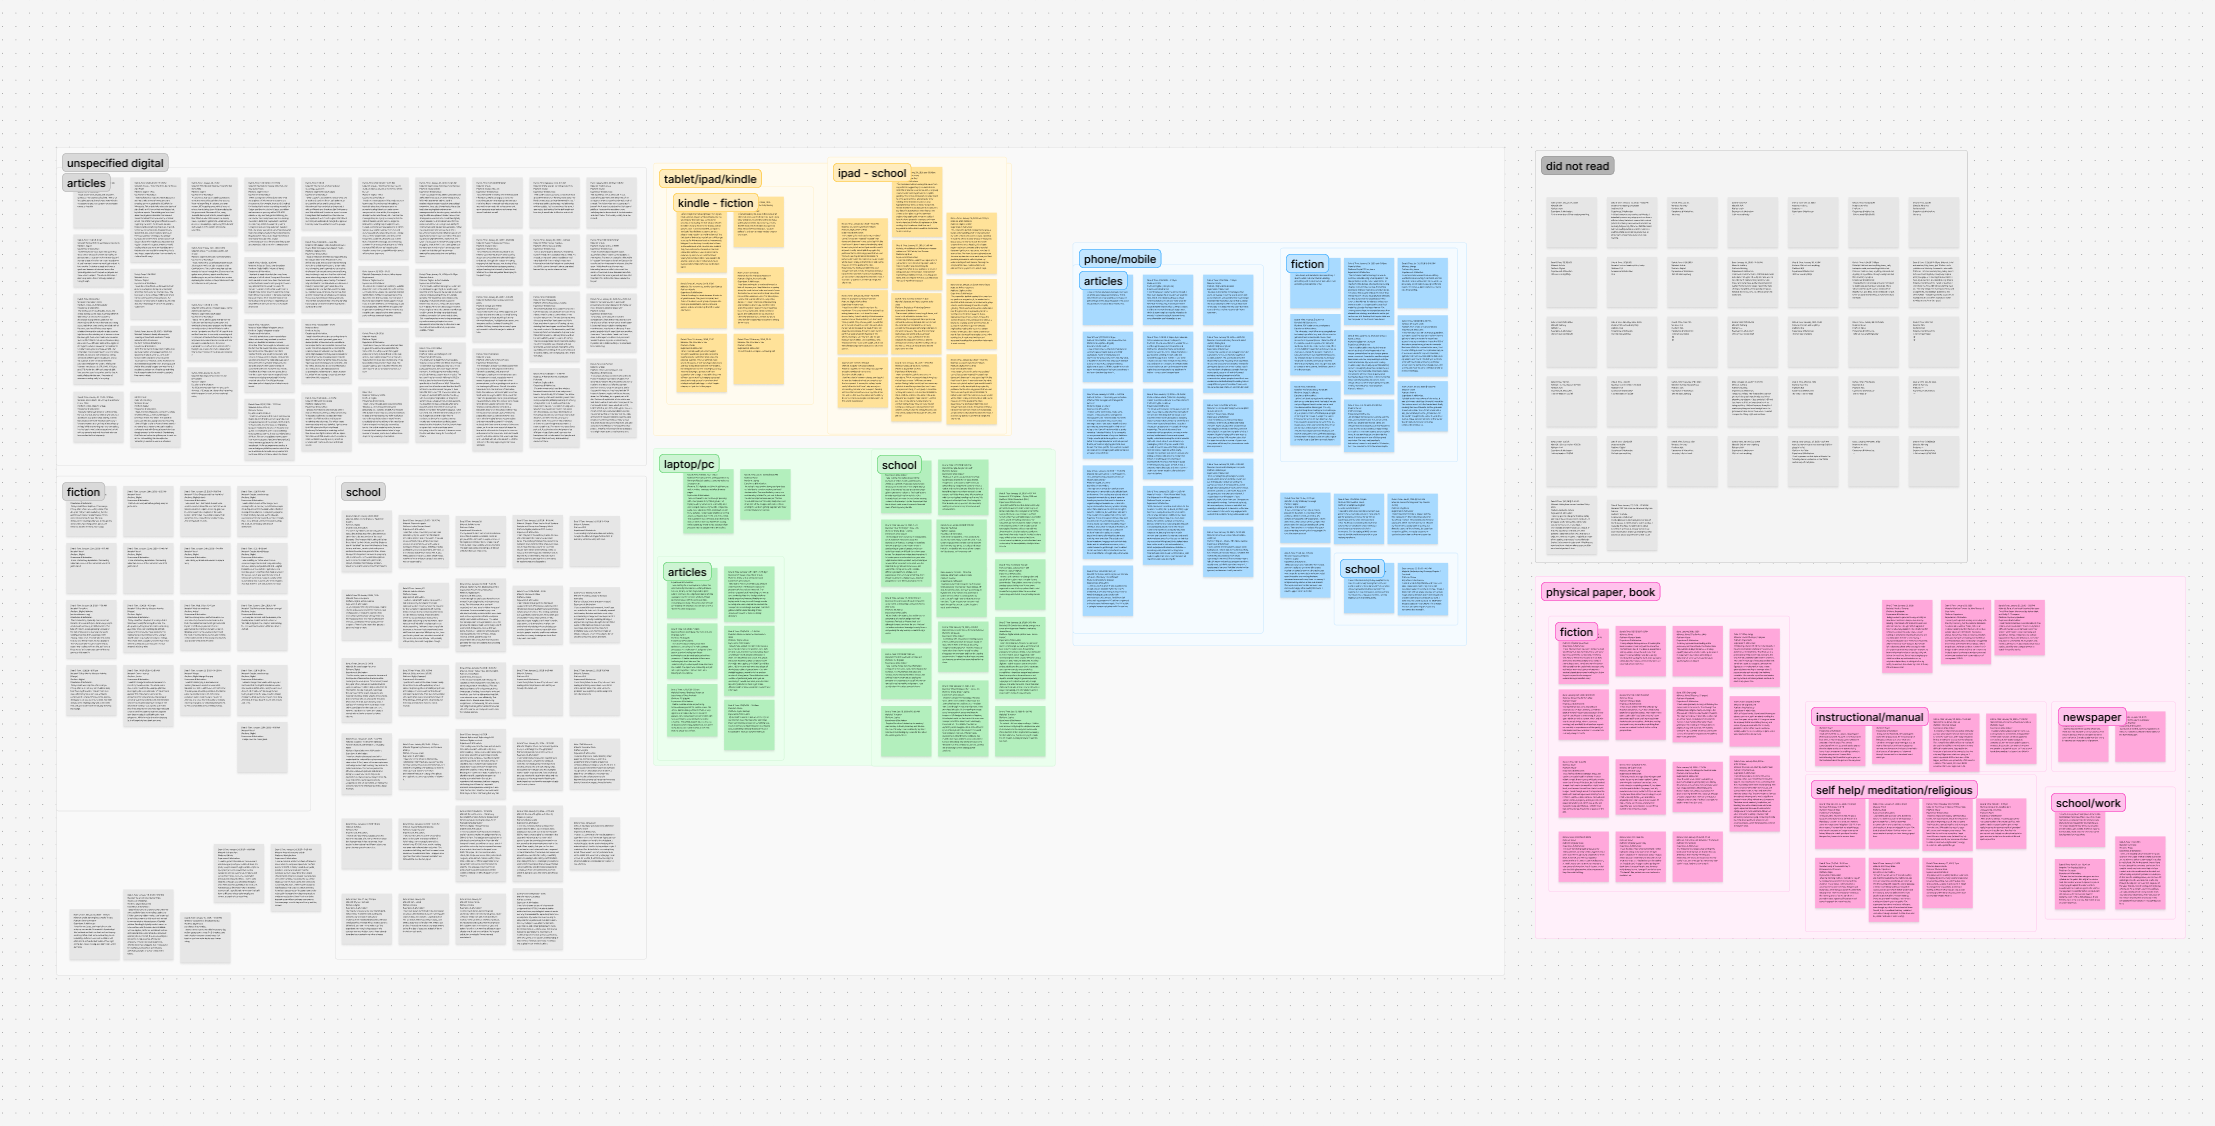
two additional diagrams mapped relationships across the primary three, surfacing the patterns that drive the central insight.
device choice and reading purpose are strongly linked. ipads were used exclusively for academic work with zero leisure entries, despite their personal form factor. kindles were reserved entirely for fiction. physical books carried the most personally meaningful content. multi-purpose digital devices carry the obligatory load; dedicated devices are saved for content people actually want to read.
fiction reading grew steadily across the day: 4 entries in the morning, 10 in the afternoon, 12 in the evening, 17 at night. reading for enjoyment was consistently deferred until obligations were complete. academic reading peaked in the afternoon across every time window, likely tied to class schedules and transit gaps.
users approach reading in two fundamentally different emotional states: obligation and desire. these states determine what they need from an interface more than the content itself does. a feature that serves one will actively harm the other if applied without distinction.
this was my first time conducting qualitative analysis independently from start to finish. the study was designed and run by the professor. my role was to take the raw aggregated dataset and do all of the categorization, diagramming, and interpretation myself.
the biggest challenge wasn't the data, it was learning when to stop. affinity diagramming has no single correct answer, only more and less defensible ones. i kept finding new ways to organize the same entries, and learning to commit to an interpretation and articulate why was the most valuable skill i took from the project.
i came away wanting to do more of this kind of work. structuring ambiguous data into coherent patterns is engaging to me and i can see it becoming a core part of how i want to contribute professionally.